First we’ll start off with a brief summary of the data that communicates the general idea in a very simple manner. If you want to delve deeper into the details we highly recommend reading the full journal.
What we’ve done with this analysis is we have computed the average weekly returns spanning between 2014 and 2020 for BTC, ETH, Total Market Cap index and Alts Market Cap index. We then analysed this data to project which weeks are likely to deliver the most returns given that Q2 is highly bullish. We’ve created this analysis as we are using it ourselves to pinpoint when we want to start trimming positions and fully rotate out of sh*tcoins (i.e. sell them in full) to avoid bag-holding.
Before you proceed, please note that this data is based on averages and just because it happened in the past, it does not mean it will play out again. With that being said, we personally believe what Mark Twain once stated:
“History doesn’t repeat itself but it often rhymes”
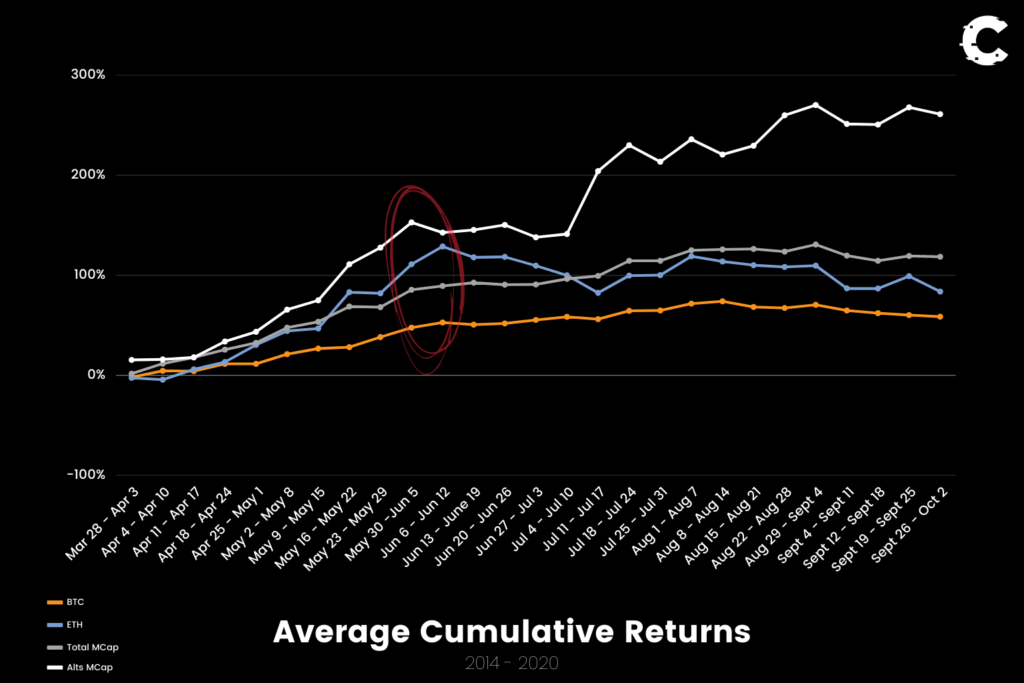
As this section is just a summary, we’ve taken all the data and plotted the “Cumulative Returns” delivered by each of these assets/indexes.
Disclaimer: NOT FINANCIAL NOR INVESTMENT ADVICE. Only you are responsible for any capital-related decisions you make and only you are accountable for the results. Past performance is no guarantee of future results
TLDR
- The accelerated rallies have happened in May and ended in mid-June.
- Mid-June till September is where the market tends to see weakness from buyers.
- Market tends to bounce in July, with Alts rebounding hard (usually mid-July) before stalling again.
- 2021 volatility was very high which means the periods of stalling showing on the graph below will likely be periods of corrections this year.
- Q3 correction is likely.
- Red circled area is where we speculate the top may form.
The most bullish weeks, based on historic data, are:
- May 16 – May 22
- May 30 – June 5

No matter how much data one gathers, it is impossible to determine exactly when the top will form but we can get pretty close to it and that is what we aim to achieve here.
Detailed Analysis
The data will range all the way from April into September to give a prolonged view as to what is most likely to occur over multiple months. We will breakdown the returns on both monthly and weekly timeframes on: BTC, ETH, Total MCap & Alts MCap.
Bitcoin
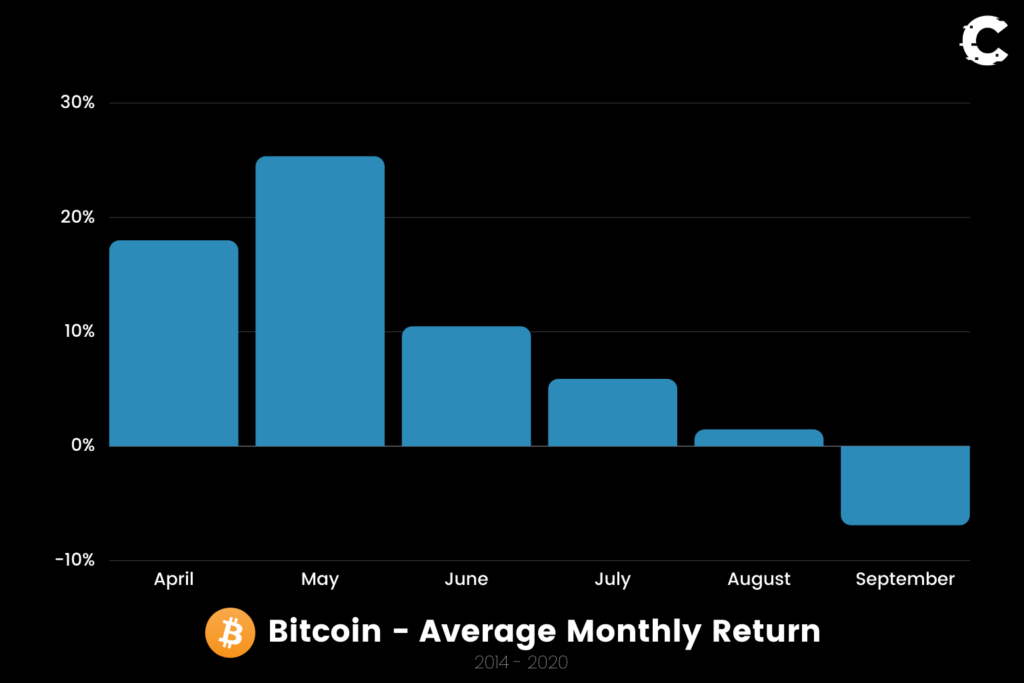
First and foremost we will start with BTC, the largest cryptocurrency by market cap. Let’s start with the monthly returns:

The general consensus is that the second quarter (Q2) which spans from April till end of June is a bullish period for BTC. The most bullish month out of them being May. On the other hand, Q3 is not as bullish and tends to be choppy (stagnation) or bearish. Given the fact that we’ve seen a very sharp rise in price, the most probable outcome is a Q3 correction between August and September.
Now that we’ve pin-pointed which months have been the most bullish/bearish, let’s zoom in a bit further to see which weeks in particular were responsible for the majority of the returns:

Overall it’s obvious that the majority of returns statistically happen before mid-June. It is factually correct that Bitcoin’s price does grind up after mid-June slightly but the market strength starts dissipating. We have seen larger than usual returns this year and hence when the strength dissipating it is more likely that the market corrects.
Today is May 9th, the week ahead has historically brought an average of +4.60% for Bitcoin’s price. The larger returns spanned between May 23rd till June 12th.
Ether
Next, we will analyse ETH’s historic returns; starting with average monthly returns:

The same conclusion of Bullish Q2 can be stated here for ETH as well, with May being more bullish for price than April – which at this point may have become obvious with ETH approaching $4,000. Q3 is where ETH weakens on average and hence planning accordingly may be beneficial.
Now let’s zoom-in using the weekly returns:

The same observations from BTC can be applied here but let’s look at individual weeks (today is May 9th) – we’re looking at the most interesting ones only:
- May 9 – May 15: +2%
- May 16 – May 22: +25%
- May 23 – May 29: -1%
- May 30 – June 5: +16%
- June 6 – June 12: +8%
- June 13 – June 19: -5%
This week is likely to be a stagnation week for ETH if we were to base our theory on statistics. The week after it has historically been the most bullish individual week in Q2/Q3 which we’re highly looking forward to.
End of May till mid-June will likely be bullish after which price action has historically weakened.
Total Market Cap
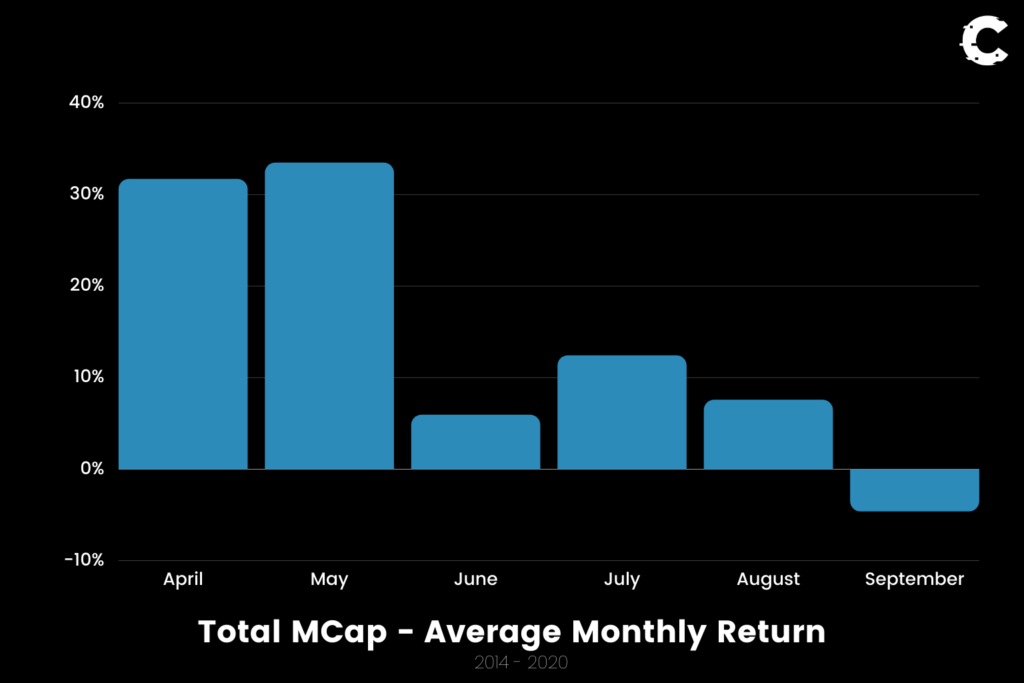
Now we will take a look at the entire market through the Total MCap index, starting off with average monthly returns:

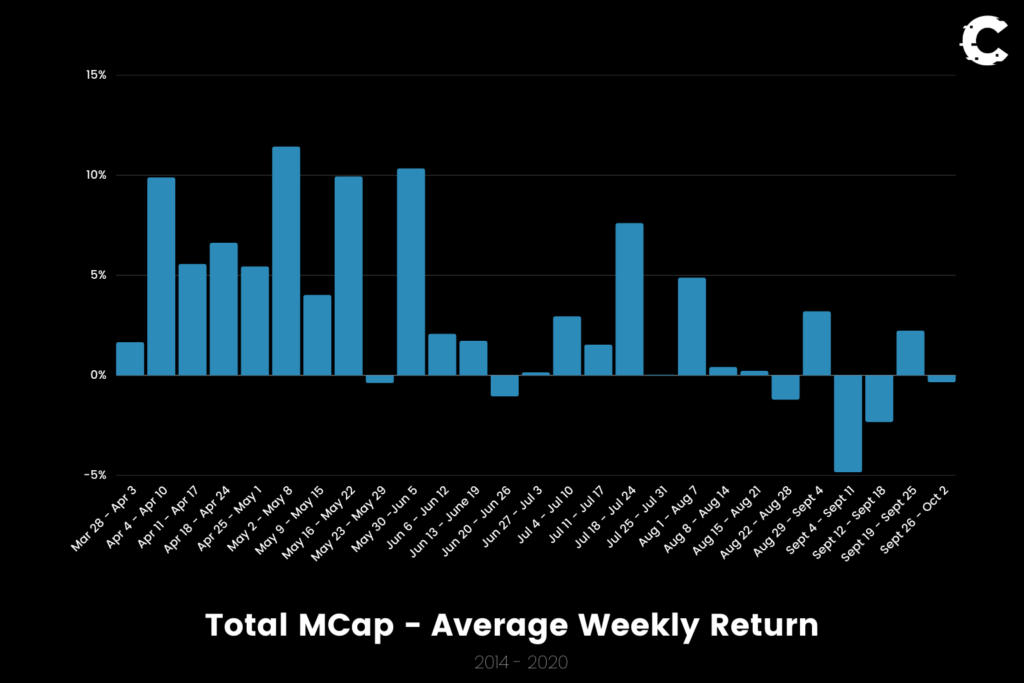
The similarities are very strong, with April/May being very bullish, followed by a weaker June, a rebound in July and weakness showing up again in the market in August and intensifying in September. Now let’s zoom in:

- May 9 – May 15: +4%
- May 16 – May 22: +10%
- May 23 – May 29: -0.5%
- May 30 – June 5: +10%
- June 6 – June 12: +2%
- June 13 – June 19: +2%
Two weeks stand out for the market overall and that is May 16 till May 22nd and May 30th till June 5th.
Altcoins Market Cap
If we remove Bitcoin from the Total MCap we’ll be left with a clear image on what happens to Altcoins on average.

If we were to breakdown this data it would be as simple as: April is bullish, May even more so while June is generally weak with a rebound in July before more weakness. Of course this is an average and not a 100% predictive model.

- May 9 – May 15: +6%
- May 16 – May 22: +21%
- May 23 – May 29: +8%
- May 30 – June 5: +11%
- June 6 – June 12: -4%
- June 13 – June 19: +1%
The same two weeks are highly bullish for Altcoins based off of history but two other particular weeks stand out: 11-17 & 18-24 July with a +26% and +9% return respectively. If we overlay this with the Total MCap returns, we know that July is usually a rebound/bounce period but it is now clear that Alts have historically delivered an outstanding return in those weeks compared to BTC or even ETH.
Source: Cryptonary, Karim Abuzeineh


